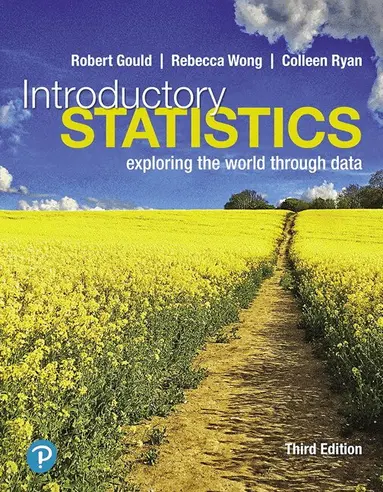
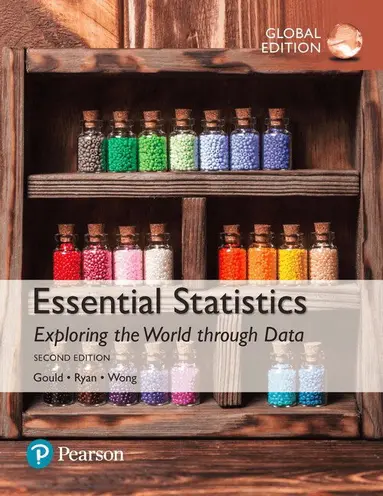
Essential Statistics -- ACCUMULATOR
627 kr
Beställningsvara. Skickas inom 10-15 vardagar. Fri frakt över 249 kr.
Produktinformation
- Märke:Pearson Education
- Utgivningsdatum:2020-01-01
- Språk:Engelska
- Upplaga:3
- Förlag:Pearson Education
- EAN:9780136570639
Utforska kategorier
Mer om författaren
Robert L. Gould (Ph.D., University of California, Los Angeles) is a leader in the statistics education community. He has served as chair of the American Statistical Association’s (ASA) Statistics Education Section, chair of the American Mathematical Association of Two-Year Colleges/ASA Joint Committee, and has served on the National Council of Teacher of Mathematics/ASA Joint Committee. He served on a panel of co-authors for the 2005 Guidelines for Assessment and Instruction in Statistics Education (GAISE) College Report and is co-author on the revision for the GAISE K-12 Report. As lead principal investigator of the NSF-funded Mobilize Project, he led the development of the first high school level data science course, which is taught in the Los Angeles Unified School District and several other districts. Rob teaches in the Department of Statistics at UCLA, where he directs the undergraduate statistics program and is director of the UCLA Center for Teaching Statistics. In recognition for his activities in statistics education, in 2012 Rob was elected Fellow of the American Statistical Association. He is the 2019 recipient of the ASA Waller Distinguished Teaching Award and the USCOTS Lifetime Achievement Award. In his free time, Rob plays the cello and enjoys attending concerts of all types and styles. Rebecca K. Wong has taught mathematics and statistics at West Valley College for more than twenty years. She enjoys designing activities to help students explore statistical concepts and encouraging students to apply those concepts to areas of personal interest. Rebecca earned at B.A. in mathematics and psychology from the University of California, Santa Barbara, an M.S.T. in mathematics from Santa Clara University, and an Ed.D. in Educational Leadership from San Francisco State University. She has been recognized for outstanding teaching by the National Institute of Staff and Organizational Development and the California Mathematics Council of Community Colleges. When not teaching, Rebecca is an avid reader and enjoys hiking trails with friends. Colleen N. Ryan has taught statistics, chemistry, and physics to diverse community college students for decades. She taught at Oxnard College from 1975 to 2006, where she earned the Teacher of the Year Award. Colleen currently teaches statistics part-time at Moorpark Community College. She often designs her own lab activities. Her passion is to discover new ways to make statistical theory practical, easy to understand, and sometimes even fun. Colleen earned a B.A. in physics from Wellesley College, an M.A.T. in physics from Harvard University, and an M.A. in chemistry from Wellesley College. Her first exposure to statistics was with Frederick Mosteller at Harvard. In her spare time, Colleen sings, has been an avid skier, and enjoys time with her family.

Innehållsförteckning
- Table of Contents PrefaceIndex of Applications Introduction to Data Case Study—Deadly Cell Phones?1.1 What Are Data?1.2 Classifying and Storing Data1.3 Organizing Categorical Data1.4 Collecting Data to Understand Causality Data Project–How Are Data Stored?Picturing Variation with Graphs Case Study—Student-to-Teacher Ratio at Colleges2.1 Visualizing Variation in Numerical Data2.2 Summarizing Important Features of a Numerical Distribution2.3 Visualizing Variation in Categorical Variables2.4 Summarizing Categorical Distributions2.5 Interpreting Graphs Data Project–Asking QuestionsNumerical Summaries of Center and Variation Case Study—Living in a Risky World3.1 Summaries for Symmetric Distributions3.2 What’s Unusual? The Empirical Rule and z-Scores3.3 Summaries for Skewed Distributions3.4 Comparing Measures of Center3.5 Using Boxplots for Displaying Summaries Data Project–The Statistical Investigation CycleRegression Analysis: Exploring Associations between Variables Case Study—Forecasting Home Prices4.1 Visualizing Variability with a Scatterplot4.2 Measuring Strength of Association with Correlation4.3 Modeling Linear Trends4.4 Evaluating the Linear Model Data Project–Data MovesModeling Variation with Probability Case Study—SIDS or Murder?5.1 What Is Randomness?5.2 Finding Theoretical Probabilities5.3 Associations in Categorical Variables5.4 Finding Empirical Probabilities Data Project–Submitting DataModeling Random Events: The Normal and Binomial Models Case Study—You Sometimes Get More Than You Pay For6.1 Probability Distributions Are Models of Random Experiments6.2 The Normal Model6.3 The Binomial Model (optional) Data Project–Generating Random NumbersSurvey Sampling and Inference Case Study—Spring Break Fever: Just What the Doctors Ordered?7.1 Learning about the World through Surveys7.2 Measuring the Quality of a Survey7.3 The Central Limit Theorem for Sample Proportions7.4 Estimating the Population Proportion with Confidence Intervals7.5 Comparing Two Population Proportions with Confidence Data Project–Population ProportionsHypothesis Testing for Population Proportions Case Study—Dodging the Question8.1 The Essential Ingredients of Hypothesis Testing8.2 Hypothesis Testing in Four Steps8.3 Hypothesis Tests in Detail8.4 Comparing Proportions from Two Populations Data Project–Dates as DataInferring Population Means Case Study—You Look Sick! Are You Sick?9.1 Sample Means of Random Samples9.2 The Central Limit Theorem for Sample Means9.3 Answering Questions about the Mean of a Population9.4 Hypothesis Testing for Means9.5 Comparing Two Population Means9.6 Overview of Analyzing Means Data Project–Data StructuresAnalyzing Categorical Variables and Interpreting Research Case Study—Popping Better Popcorn10.1 The Basic Ingredients for Testing with Categorical Variables10.2 Chi-Square Tests for Associations between Categorical Variables10.3 Reading Research Papers Data Project–Think SmallAppendix A Tables Appendix B Check Your Tech Answers Appendix C Credits Index
Mer från samma författare
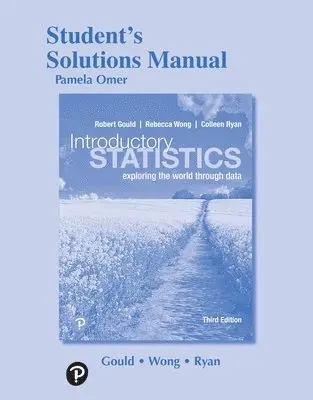
Student Solutions Manual for Introductory Statistics
Robert Gould, Colleen Ryan
Inbunden, 2019
1 409 kr
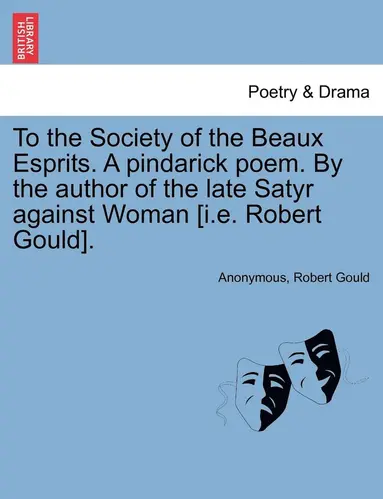
To the Society of the Beaux Esprits. a Pindarick Poem. by the Author of the Late Satyr Against Woman [i.E. Robert Gould].
Anonymous, Robert Gould
Häftad, 2011
230 kr
Sylvia's Revenge, Or; A Satyr Against Man [by Richard Ames]; In Answer to the Satyr Against Woman [by Robert Gould].
Richard Ames, Robert Gould
Häftad, 2011
229 kr
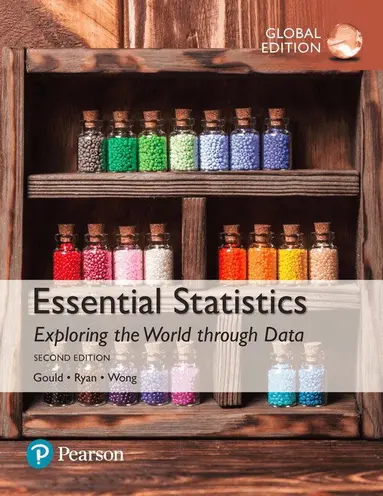
Essential Statistics, Global Edition + MyLab Statistics with Pearson eText
Robert Gould, Colleen Ryan, Rebecca Wong
1 374 kr
Du kanske också är intresserad av
Essential Statistics, Global Edition + MyLab Statistics with Pearson eText
Robert Gould, Colleen Ryan, Rebecca Wong
1 374 kr
Student Solutions Manual for Introductory Statistics
Robert Gould, Colleen Ryan
Inbunden, 2019
1 409 kr
Sylvia's Revenge, Or; A Satyr Against Man [by Richard Ames]; In Answer to the Satyr Against Woman [by Robert Gould].
Richard Ames, Robert Gould
Häftad, 2011
229 kr