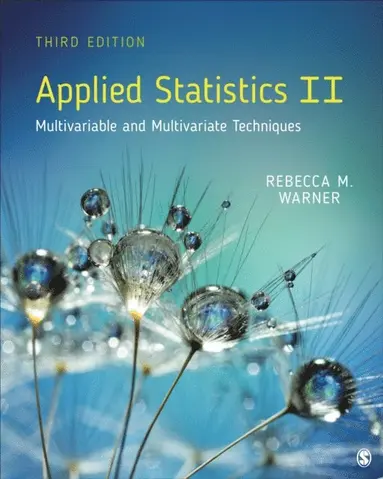
Applied Statistics II
Multivariable and Multivariate Techniques
2 514 kr
Beställningsvara. Skickas inom 3-6 vardagar. Fri frakt över 249 kr.
Fler format och utgåvor
Beskrivning
Produktinformation
- Utgivningsdatum:2020-04-14
- Mått:203 x 254 mm
- Format:Häftad
- Språk:Engelska
- Antal sidor:672
- Upplaga:3
- Förlag:SAGE Publications Inc
- ISBN:9781544398723
Utforska kategorier
Mer om författaren
Rebecca M. Warner received a B.A. from Carnegie-Mellon University in Social Relations in 1973 and a Ph.D. in Social Psychology from Harvard in 1978. She has taught statistics for more than 25 years: from Introductory and Intermediate Statistics to advanced topics seminars in Multivariate Statistics, Structural Equation Modeling, and Time Series Analysis. She is currently a Full Professor in the Department of Psychology at the University of New Hampshire. She is a Fellow in the Association for Psychological Science and a member of the American Psychological Association, the International Association for Relationships Research, the Society of Experimental Social Psychology, and the Society for Personality and Social Psychology. She has consulted on statistics and data management for the World Health Organization in Geneva and served as a visiting faculty member at Shandong Medical University in China.
Innehållsförteckning
- 1. The New StatisticsRequired BackgroundWhat is the “New Statistics”?Common Misinterpretations of p ValuesProblems with NHST Logic The Replication CrisesCommon Misuses of NHSTThe Replication CrisisSome Proposed Remedies for NHST ProblemsReview of Confidence IntervalsEffect SizeBrief Introduction to Meta-AnalysisRecommendations for Better Research and AnalysisSummary2. Advanced Data Screening: Outliers and Missing ValuesIntroductionVariable Names and File ManagementSources of BiasScreening Sample DataPossible Remedy for Skewness: Nonlinear Data TransformationsIdentification of OutliersHandling OutliersTesting Linearity AssumptionsEvaluation of Other Assumptions Specific to AnalysesDescribing Amount of Missing DataHow Missing Data ArisePatterns in Missing DataEmpirical Example: Detecting Type a MissingnessPossible Remedies for Missing DataEmpirical Example: Multiple Imputation to Replace Missing ValuesData Screening ChecklistReporting GuidelinesSummaryAppendix 2 A Brief Note About Zero Inflated Binomial or Poisson Regression3. Statistical Control: How an X, Y Association Can Change When a Control Variable is AddedWhat is Statistical Control?First Research Example: Controlling for a Categorical X2 VariableAssumptions for Partial Correlation Between X1 and Y, Controlling for X2Notation for Partial CorrelationComputing Partial Correlation: Use of Bivariate Regressions to Remove Variance Predictable by X2 from Both X1 and YPartial Correlation Makes No Sense if There is An X1 x X2 InteractionComputation of Partial r From Bivariate Pearson CorrelationsSignificance Tests, Confidence Intervals, and Statistical Power for Partial CorrelationsComparing Outcomes for ry1.2 and ry1Introduction to Path ModelsPossible Paths Among X1, Y, and X2One Possible Model: X1 and Y are Not Related Whether You Control for X2 or NotPossible Model: Correlation Between X1 and Y is the Same Whether X2 is Statistically Controlled or Not (X2 is Irrelevant to the X1, Y Relationship)When You Control for X2, Correlation Between X1 and Y Drops to 0When You Control for X2, the Correlation Between X1 and Y Becomes Smaller (But Does not Drop to 0 or Change Sign)Some Forms of Suppression: When You Control for X2, r1y.2 Becomes Larger Than r1y or Opposite in Sign to r1y.“None of the Above”Results SectionSummary4. Partition of Variance in RegressionIntroductionHypothetical Research ExampleGraphic Representation of Regression PlaneSemipartial (or “Part”) CorrelationPartition of Variance In Y in Regression with Two PredictorsAssumptions for Regression With Two PredictorsFormulas for Regression With Two PredictorsSPSS RegressionConceptual Basis: Factors that Affect the Magnitude and Sign of ? and b in Regression With Two PredictorsTracing Rules for Path ModelsComparison of Equations for ?, b, pr, and srNature of Predictive RelationshipsEffect Size Information in Regression with Two PredictorsStatistical PowerIssues in Planning a StudyResultsSummary5. Multiple RegressionResearch QuestionsEmpirical ExampleScreening for Violations of AssumptionsIssues in Planning a StudyComputation of Regression Coefficients with k Predictor VariablesMethods of Entry for Predictor VariablesVariance Partitioning in Standard Regression Versus Hierarchical and Statistical RegressionSignificance Test for an Overall Regression ModelSignificance Tests for Individual Predictors in Multiple RegressionEffect SizeChanges in F and R as Additional Predictors Are Added to a Model in Sequential or Statistical RegressionStatistical PowerNature of the Relationship Between Each X Predictor and Y (Controlling for Other Predictors)Assessment of Multivariate Outliers in RegressionSPSS Examples and ResultsSummaryAppendix 5 A Use of Matrix Algebra to Estimate Regression Coefficients for Multiple PredictorsAppendix 5 B Tables for Wilkinson and Dallal (1981) Test of Significance of Multiple R2 in Forward Statistical Regression6. Dummy Predictor Variables in Multiple RegressionWhat Dummy Variables Are and When They Are UsedEmpirical ExampleScreening for Violations of AssumptionsIssues in Planning a StudyParameter Estimates and Significance Tests for Regressions with Dummy Predictor VariablesGroup Mean Comparisons Using One-Way Between-S ANOVAThree Methods of Coding for Dummy VariablesRegression Models That Include Both Dummy and Quantitative Predictor VariablesEffect Size and Statistical PowerNature of the Relationship and/or Follow-Up TestsResultsSummary7. Moderation: Interaction in Multiple RegressionTerminologyInteraction Between Two Categorical Predictors: Factorial ANOVAInteraction Between One Categorical and One Quantitative PredictorPreliminary Data Screening: One Categorical and One Quantitative PredictorScatterplot for Preliminary Assessment of Possible Interaction Between Categorical and Quantitative PredictorRegression to Assess Statistical Significance of Interaction Between One Categorical and One Quantitative PredictorInteraction Analysis With More Than Three CategoriesExample With Different Data: Significant Sex by Years InteractionFollow-Up: Analysis of Simple Main EffectsInteraction Between Two Quantitative PredictorsSPSS Example of Interaction Between Two Quantitative PredictorsResults for Interaction of Age and Habits as Predictors of SymptomsGraphing Interaction for Two Quantitative PredictorsResults Section for Interaction of Two Quantitative PredictorsAdditional Issues and SummaryAppendix 7 A Graphing Interactions Between Quantitative Variables “By Hand”8. Analysis of CovarianceResearch Situations for ANCOVAEmpirical ExampleScreening for Violations of AssumptionsVariance Partitioning in ANCOVAIssues in Planning a StudyFormulas for ANCOVAComputation of Adjusted Effects and Adjusted Y* MeansConceptual Basis: Factors that Affect the Magnitude of SSAadj and SSresidual and the Pattern of Adjusted Group MeansEffect SizeStatistical PowerNature of the Relationship and Follow-Up Tests: Information to Include in the Results SectionSPSS Analysis and ResultsAdditional Discussion of ANCOVA ResultsSummaryAppendix 8 A Alternative Methods for the Analysis of Pretest/Posttest Data9. MediationDefinition of MediationHypothetical Research ExampleLimits of “Causal” ModelsQuestions in a Mediation AnalysisIssues in Designing a Mediation Analysis StudyAssumptions in Mediation Analysis and Preliminary Data ScreeningPath Coefficient EstimationConceptual Issues: Assessment of Direct Versus Indirect PathsEvaluating Statistical SignificanceEffect Size InformationSample Size and Statistical PowerAdditional Examples of MediationNote About Use of Structural Equation Modeling Programs to Test Mediation HypothesesResults SectionSummary10. Discriminant AnalysisResearch Situations and Research QuestionsIntroduction to Empirical ExampleScreening for Violations of AssumptionsIssues in Planning a StudyEquations for Discriminant AnalysisConceptual Basis: Factors That Affect the Magnitude of Wilks’s LEffect SizeStatistical Power and Sample Size RecommendationsFollow-Up Tests to Assess What Pattern of Scores Best Differentiates GroupsResultsOne-Way ANOVA on Scores on Discriminant FunctionsSummaryAppendix 10 A The Eigenvalue/ Eigenvector ProblemAppendix 10 B Additional Equations for Discriminant Analysis11. Multivariate Analysis of Variance (MANOVA)Research Situations and Research QuestionsFirst Research Example: One-Way MANOVAWhy Include Multiple Outcome Measures?Equivalence of MANOVA and DAThe General Linear ModelAssumptions and Data ScreeningIssues in Planning a StudyConceptual Basis of MANOVAMultivariate Test StatisticsFactors that Influence the Magnitude of Wilks’s LambdaEffect Size for MANOVAStatistical Power and Sample Size DecisionsOne Way MANOVA: Career Group Data2 x 3 Factorial MANOVA: Career Group DataSignificant Interaction in a 3 x 6 MANOVAComparison of Univariate Versus Multivariate Follow Up AnalysesSummary12. Exploratory Factor AnalysisResearch SituationsPath Model for Factor AnalysisFactor Analysis as a Method of Data ReductionIntroduction of Empirical ExampleScreening for Violations of AssumptionsIssues in Planning a Factor-Analytic StudyComputation of Factor LoadingsSteps in the Computation of Principal Components and Factor AnalysisAnalysis One: Principal Components Analysis of Three Items Retaining All Three ComponentsAnalysis Two: Principal Component Analysis of Three Items Retaining Only the First ComponentPrincipal Components Versus Principal Axis FactoringAnalysis 3: PAF of Nine Items, Two Factors Retained, No RotationGeometric Representation of Factor RotationFactor Analysis as Two Sets of Multiple RegressionsFinal Analysis/ Analysis 4: PAF With Varimax RotationQuestions to Address in the Interpretation of Factor AnalysisResults Section for Analysis 4: PAF With Varimax RotationFactor Scores Versus Unit-Weighted CompositesSummary of Issues in Factor AnalysisAppendix 12 A The Matrix Algebra of Factor AnalysisAppendix 12 B A Brief Introduction to Latent Variables in Structural Equation Modeling13. Reliability, Validity, and Multiple-Item ScalesAssessment of Measurement QualityCost and Invasiveness of MeasuresEmpirical Examples of Reliability AssessmentConcepts from Classical Measurement TheoryUse of Multiple-Item Measures to Improve Measurement ReliabilityComputation of Summated ScalesAssessment of Internal Homogeneity for Multiple-Item Measures: Cronbach’s Alpha Reliabilit CoefficientValidity AssessmentTypical Scale Development ProcessA Brief Note About Modern Measurement TheoriesReporting ReliabilitySummaryAppendix 13 A The CES-D ScaleAppendix 13 B Web Resources About Psychological Measurement14. Repeated Measures: Tests of Assumptions, Factorial Designs, and Order EffectsIntroductionReview of Assumptions for Repeated Measures ANOVAFirst Example: Heart Rate/ Social Stress StudyTest for Participant by Time or Participant by Treatment InteractionOne-Way Repeated Measures Results for HR/ Social Stress DataTesting the Sphericity AssumptionMANOVA for Repeated MeasuresResults for HR and Social Stress Analysis Using MANOVADoubly Multivariate Repeated MeasuresMixed Model ANOVA: Between-S and Within-S FactorsOrder and Sequence EffectsFirst Example: Order Effect as a NuisanceSecond Example: Order Effect is of InterestSummary and Other Complex Designs15. Structural Equation Modeling with AMOS: A Brief IntroductionWhat is Structural Equation Modeling?Review of Path ModelsMore Complex Path ModelsFirst Example: Mediation Structural ModelIntroduction to AMOS®Screening and Preparing Data for SEMSpecifying the SEM Model (Variable Names and Paths)Specifying the Analysis PropertiesRunning the Analysis and Examining ResultsLocating Bootstrapped CI InformationSample Results for the Mediation AnalysisSelected SEM Model TerminologySEM Goodness of Fit IndexesSecond Example: Confirmatory Factor AnalysisThird Example: Model with Both Measurement and Structural ComponentsReporting SEMSummary16. Binary Logistic RegressionResearch SituationsFirst Example: Dog Ownership and Odds of DeathConceptual Basis for Binary Logistic Regression AnalysisDefinition and Interpretation of OddsA New Type of Dependent Variable: The LogitTerms Involved in Binary Logistic Regression AnalysisLogistic Regression for First Example: Prediction of Death from Dog Ownership.Issues in Planning and Conducting a StudyMore Complex ModelsBinary Logistic Regression for Second Example: Drug Dose and Sex as Predictors of Odds of DeathComparison of Discriminant Analysis to Binary Logistic RegressionSummary17. Additional Statistical TechniquesIntroductionA Brief History of Developments in StatisticsSurvival AnalysisCluster AnalysesTime Series AnalysesPoisson and Binomial Regression for Zero-Inflated Count DataBayes’ TheoremMultilevel ModelingSome Final WordsSecond Example: Order Effect is of InterestSummary and Other Complex DesignsWhat is Structural Equation Modeling?Review of Path ModelsMore Complex Path ModelsFirst Example: Mediation Structural ModelIntroduction to AMOS®Screening and Preparing Data for SEMSpecifying the SEM Model (Variable Names and Paths)Specifying the Analysis PropertiesRunning the Analysis and Examining ResultsLocating Bootstrapped CI InformationSample Results for the Mediation AnalysisSelected SEM Model TerminologySEM Goodness of Fit IndexesSecond Example: Confirmatory Factor AnalysisThird Example: Model with Both Measurement and Structural ComponentsReporting SEMSummary19. Binary Logistic RegressionResearch SituationsFirst Example: Dog Ownership and Odds of DeathConceptual Basis for Binary Logistic Regression AnalysisDefinition and Interpretation of OddsA New Type of Dependent Variable: The LogitTerms Involved in Binary Logistic Regression AnalysisLogistic Regression for First Example: Prediction of Death from Dog Ownership.Issues in Planning and Conducting a StudyMore Complex ModelsBinary Logistic Regression for Second Example: Drug Dose and Sex as Predictors of Odds of DeathComparison of Discriminant Analysis to Binary Logistic RegressionSummary20. Additional Statistical TechniquesIntroductionA Brief History of Developments in StatisticsSurvival AnalysisCluster AnalysesTime Series AnalysesPoisson and Binomial Regression for Zero-Inflated Count DataBayes’ TheoremMultilevel ModelingSome Final Words
Du kanske också är intresserad av
Systrarna på Sophiahemmet
Ruth Kvarnström-Jones
Inbunden, 2026
239 kr
- -19%
- Signerad!
SIGNERAD - Mackans kost : Middagar och matlådor
Marcus Frank
Inbunden, 2026
269 kr
- Signerad!