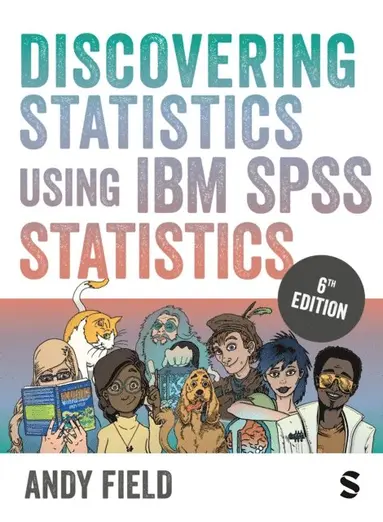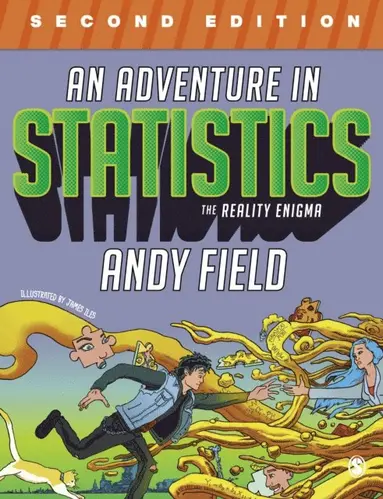
Andy Field is Professor of Quantitative Methods at the University of Sussex. He has published widely (100+ research papers, 29 book chapters, and 17 books in various editions) in the areas of child anxiety and psychological methods and statistics. His current research interests focus on barriers to learning mathematics and statistics.He is internationally known as a statistics educator. He has written several widely used statistics textbooks including Discovering Statistics Using IBM SPSS Statistics (winner of the 2007 British Psychological Society book award), Discovering Statistics Using R, and An Adventure in Statistics (shortlisted for the British Psychological Society book award, 2017; British Book Design and Production Awards, primary, secondary and tertiary education category, 2016; and the Association of Learned & Professional Society Publishers Award for innovation in publishing, 2016), which teaches statistics through a fictional narrative and uses graphic novel elements. He has also written the adventr and discovr packages for the statistics software R that teach statistics and R through interactive tutorials.His uncontrollable enthusiasm for teaching statistics to psychologists has led to teaching awards from the University of Sussex (2001, 2015, 2016, 2018, 2019), the British Psychological Society (2006) and a prestigious UK National Teaching fellowship (2010).He′s done the usual academic things: had grants, been on editorial boards, done lots of admin/service but he finds it tedious trying to remember this stuff. None of them matter anyway because in the unlikely event that you′ve ever heard of him it′ll be as the ′Stats book guy′. In his spare time, he plays the drums very noisily in a heavy metal band, and walks his cocker spaniel, both of which he finds therapeutic.
Recensioner i media
Select Guide Rating
Innehållsförteckning
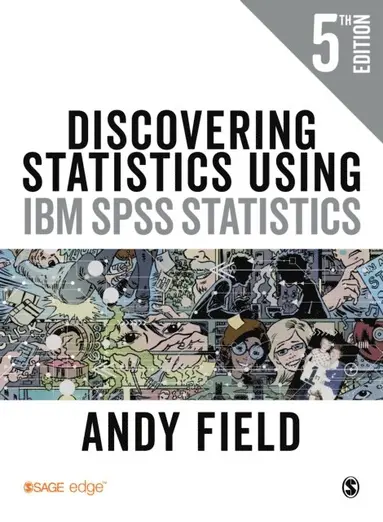
Chapter 1: Why is my evil lecturer forcing me to learn statistics?What the hell am I doing here? I don’t belong hereThe research processInitial observation: finding something that needs explainingGenerating and testing theories and hypothesesCollecting data: measurementCollecting data: research designReporting DataChapter 2: The SPINE of statisticsWhat is the SPINE of statistics?Statistical modelsPopulations and SamplesP is for parametersE is for Estimating parametersS is for standard errorI is for (confidence) IntervalN is for Null hypothesis significance testing, NHSTReporting significance testsChapter 3: The phoenix of statisticsProblems with NHSTNHST as part of wider problems with scienceA phoenix from the EMBERSSense, and how to use itPreregistering research and open scienceEffect sizesBayesian approachesReporting effect sizes and Bayes factorsChapter 4: The IBM SPSS Statistics environmentVersions of IBM SPSS StatisticsWindows, MacOS and LinuxGetting startedThe Data EditorEntering data into IBM SPSS StatisticsImporting DataThe SPSS ViewerExporting SPSS OutputThe Syntax EditorSaving filesOpening filesExtending IBM SPSS StatisticsChapter 5: Data VisualisationThe art of presenting dataThe SPSS Chart BuilderHistogramsBoxplots (box-whisker diagrams)Graphing means: bar charts and error barsLine chartsGraphing relationships: the scatterplotEditing graphsChapter 6: The beast of biasWhat is bias?OutliersOverview of assumptionsAdditivity and LinearityNormally distributed something or otherHomoscedasticity/Homogeneity of VarianceIndependenceSpotting outliersSpotting normalitySpotting linearity and heteroscedasticity/heterogeneity of varianceReducing BiasChapter 7: Non-parametric modelsWhen to use non-parametric testsGeneral procedure of non-parametric tests in SPSSComparing two independent conditions: the Wilcoxon rank-sum test and Mann– Whitney testComparing two related conditions: the Wilcoxon signed-rank testDifferences between several independent groups: the Kruskal–Wallis testDifferences between several related groups: Friedman’s ANOVAChapter 8: CorrelationModelling relationshipsData entry for correlation analysisBivariate correlationPartial and semi-partial correlationComparing correlationsCalculating the effect sizeHow to report correlation coefficentsChapter 9: The Linear Model (Regression)An Introduction to the linear model (regression)Bias in linear models?Generalizing the modelSample size in regressionFitting linear models: the general procedureUsing SPSS Statistics to fit a linear model with one predictorInterpreting a linear model with one predictorThe linear model with two of more predictors (multiple regression)Using SPSS Statistics to fit a linear model with several predictorsInterpreting a linear model with several predictorsRobust regressionBayesian regressionReporting linear modelsChapter 10: Comparing two meansLooking at differencesAn example: are invisible people mischievous?Categorical predictors in the linear modelThe t-testAssumptions of the t-testComparing two means: general procedureComparing two independent means using SPSS StatisticsComparing two related means using SPSS StatisticsReporting comparisons between two meansBetween groups or repeated measures?Chapter 11: Moderation and MediationThe PROCESS toolModeration: Interactions in the linear modelMediationCategorical predictors in regressionChapter 12: GLM 1: Comparing several independent meansUsing a linear model to compare several meansAssumptions when comparing meansPlanned contrasts (contrast coding)Post hoc proceduresComparing several means using SPSS StatisticsOutput from one-way independent ANOVARobust comparisons of several meansBayesian comparison of several meansCalculating the effect sizeReporting results from one-way independent ANOVAChapter 13: GLM 2: Comparing means adjusted for other predictors (analysis of covariance)What is ANCOVA?ANCOVA and the general linear modelAssumptions and issues in ANCOVAConducting ANCOVA using SPSS StatisticsInterpreting ANCOVATesting the assumption of homogeneity of regression slopesRobust ANCOVABayesian analysis with covariatesCalculating the effect sizeReporting resultsChapter 14: GLM 3: Factorial designsFactorial designsIndependent factorial designs and the linear modelModel assumptions in factorial designsFactorial designs using SPSS StatisticsOutput from factorial designsInterpreting interaction graphsRobust models of factorial designsBayesian models of factorial designsCalculating effect sizesReporting the results of two-way ANOVAChapter 15: GLM 4: Repeated-measures designsIntroduction to repeated-measures designsA grubby exampleRepeated-measures and the linear modelThe ANOVA approach to repeated-measures designsThe F-statistic for repeated-measures designsAssumptions in repeated-measures designsOne-way repeated-measures designs using SPSSOutput for one-way repeated-measures designsRobust tests of one-way repeated-measures designsEffect sizes for one-way repeated-measures designsReporting one-way repeated-measures designsA boozy example: a factorial repeated-measures designFactorial repeated-measures designs using SPSS StatisticsInterpreting factorial repeated-measures designsEffect Sizes for factorial repeated-measures designsReporting the results from factorial repeated-measures designsChapter 16: GLM 5: Mixed designsMixed designsAssumptions in mixed designsA speed dating exampleMixed designs using SPSS StatisticsOutput for mixed factorial designsCalculating effect sizesReporting the results of mixed designsChapter 17: Multivariate analysis of variance (MANOVA)Introducing MANOVAIntroducing matricesThe theory behind MANOVAMANOVA using SPSS StatisticsInterpreting MANOVAReporting results from MANOVAFollowing up MANOVA with discriminant analysisInterpreting discriminant analysisReporting results from discriminant analysisThe final interpretationChapter 18: Exploratory factor analysisWhen to use factor analysisFactors and ComponentsDiscovering factorsAn anxious exampleFactor analysis using SPSS statisticsInterpreting factor analysisInterpreting factor analysisReliability analysisReliability analysis using SPSS StatisticsInterpreting Reliability analysisHow to report reliability analysisChapter 19: Categorical outcomes: chi-square and loglinear analysisAnalysing categorical dataAssociations between two categorical variablesAssociations between several categorical variables: loglinear analysisAssumptions when analysing categorical dataGeneral procedure for analysing categorical outcomesDoing chi-square using SPSS StatisticsInterpreting the chi-square testLoglinear analysis using SPSS StatisticsInterpreting loglinear analysisReporting the results of loglinear analysisChapter 20: Categorical outcomes: logistic regressionWhat is logistic regression?Theory of logistic regressionSources of bias and common problemsBinary logistic regressionInterpreting logistic regressionReporting logistic regressionTesting assumptions: another examplePredicting several categories: multinomial logistic regressionChapter 21: Multilevel linear modelsHierarchical dataTheory of multilevel linear modelsThe multilevel modelSome practical issuesMultilevel modelling using SPSS StatisticsGrowth modelsHow to report a multilevel modelA message from the octopus of inescapable despairChapter 22: Epilogue
Betyg & recensioner
4,7/5
5,0 utav 5 stjärnor
5/5
En riktigt bra statistikbok
Alltså... Andy Field förvandlar något torrt och tråkigt till lättförståeligt och roligt genom personliga anekdoter <3 Den här boken rekommenderas varmt till alla som vill arbeta med SPSS
Maria
5,0 utav 5 stjärnor
5/5
Innehållsrik bok
Mycket bra och innehållsrik bok som är bra att ha som uppslagsverk eller referens.
Förklarar enkla saker men också mer komplicerade samband för proffsen.
Claes J
5,0 utav 5 stjärnor
5/5
Rolig statistik av Andy Field
Jag har använt SPSS i flera år men inte tyckt att jag behärskar det särskilt bra. Nu har jag äntligen hittat en författare som beskriver statistik på en trevligt och lättfattligt sätt. Många författare får läsaren att känna sig dum och jag avskyr det. Även om man inte använder SPSS utan bara är allmänt intresserad av statistik är Andy Fields bok ett mästerverk och oumbärlig i bokhyllan.
Petra D
5,0 utav 5 stjärnor
5/5
Extremt lätt att ha att göra med. Humoristisk och leder ibland till spontana skrattattacker(!!). Men innehåller samtidigt i princip allt man behöver.
Sakarias B
5,0 utav 5 stjärnor
5/5
Lättläst och fylld med bra exempel. Mycket pedagogiskt upplägg och framförallt fylld med humor. Det känns helt plötsligt intressant med statistik och SPSS.