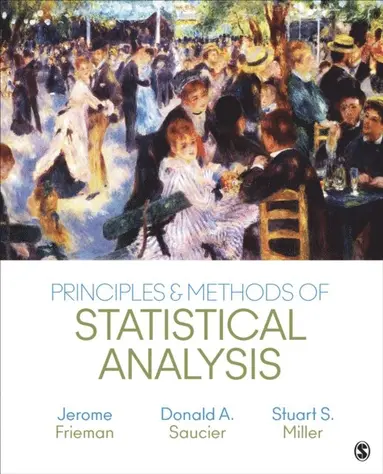
Principles & Methods of Statistical Analysis
AvJerome Frieman,Donald A. Saucier
2 192 kr
Beställningsvara. Skickas inom 3-6 vardagar. Fri frakt över 249 kr.
Beskrivning
Produktinformation
- Utgivningsdatum:2017-04-13
- Mått:187 x 231 x 32 mm
- Vikt:1 080 g
- Format:Inbunden
- Språk:Engelska
- Antal sidor:528
- Upplaga:1
- Förlag:SAGE Publications Inc
- ISBN:9781483358598
Utforska kategorier
Mer om författaren
Jerome Frieman earned his PhD from Kent State University in Ohio. He has been at Kansas State University since 1968. Over the course of his career, he engaged in research on operant conditioning in pigeons, rats, and dwarf hamsters; Pavlovian conditioning in rats; social learning in dwarf hamsters; and extraordinary memory in a human participant. He is the author of Learning and Adaptive Behavior and co-author of Memory Search by a Memorist.
Recensioner i media
Select Guide Rating
Innehållsförteckning
- PrefaceAbout the AuthorsProloguePART I • GETTING STARTEDChapter 1: The Big PictureModelsThe Classical Statistical ModelDesigning Experiments and Analyzing DataSummaryQuestions Raised by the Use of the Classical Statistical ModelConceptual ExercisesChapter 2: Examining Our Data: An Introduction to Some of the Techniques of Exploratory Data AnalysisDescriptive StatisticsHistogramsExploratory Data AnalysisQuantile PlotsStem-and-Leaf DisplaysLetter-Value DisplaysBox PlotsDid My Data Come From a Normal Distribution?Why Should We Care About Looking at Our Data?SummaryConceptual ExercisesPART II • THE BEHAVIOR OF DATAChapter 3: Properties of Distributions: The Building Blocks of Statistical InferenceThe Effects of Adding a Constant or Multiplying by a ConstantThe Standard Score TransformationThe Effects of Adding or Subtracting Scores From Two Different DistributionsThe Distribution of Sample MeansThe Central Limit TheoremAveraging Means and VariancesExpected ValueTheorems on Expected ValueSummaryConceptual ExercisesPART III • THE BASICS OF STATISTICAL INFERENCE: DRAWING CONCLUSIONS FROM OUR DATAChapter 4: Estimating Parameters of Populations From Sample DataStatistical Inference With the Classical Statistical ModelCriteria for Selecting Estimators of Population ParametersMaximum Likelihood EstimationConfidence IntervalsBeyond Normal Distributions and Estimating Population MeansSummaryConceptual ExercisesChapter 5: Resistant Estimators of ParametersA Closer Look at Sampling From Non-Normal PopulationsThe Sample Mean and Sample Median Are L-EstimatorsMeasuring the Influence of Outliers on Estimates of Location and Spread?-Trimmed Means as Resistant and Efficient Estimators of LocationWinsorizing: Another Way to Create a Resistant Estimator of LocationApplying These Resistant Estimators to Our DataResistant Estimators of SpreadApplying These Resistant Estimators to Our Data (Part 2)M-Estimators: Another Approach to Finding Resistant Estimators of LocationWhich Estimator of Location Should I Use?Resampling Methods for Constructing Confidence IntervalsA Final CaveatSummaryConceptual ExercisesChapter 6: General Principles of Hypothesis TestingExperimental and Statistical HypothesesEstimating ParametersThe Criterion for Evaluating Our Statistical HypothesesCreating Our Test StatisticDrawing Conclusions About Our Null HypothesisBut Suppose H0 Is False?Errors in Hypothesis TestingPower and Power FunctionsThe Use of Power Functionsp-Values, a, and Alpha (Type I) Errors: What They Do and Do Not MeanA Word of Caution About Attempting to Estimate the Power of a Hypothesis Test After the Data Have Been CollectedIs It Ever Appropriate to Use a One-Tailed Hypothesis Test?What Should We Mean When We Say Our Results Are Statistically Significant?A Final WordSummaryConceptual ExercisesPART IV • SPECIFIC TECHNIQUES TO ANSWER SPECIFIC QUESTIONSChapter 7: The Independent Groups t-Tests for Testing for Differences Between Population MeansStudent’s t-testDistribution of the Independent Groups t-Statistic when H0 Is TrueDistribution of the Independent Groups t-Statistic When H0 Is FalseFactors That Affect the Power of the Independent Groups t-TestThe Assumption Behind the Homogeneity of Variance AssumptionGraphical Methods for Comparing Two GroupsSuppose the Population Variances Are Not Equal?Standardized Group Differences as Estimators of Effect SizeRobust Hypothesis TestingResistant Estimates of Effect SizeSummaryConceptual ExercisesChapter 8: Testing Hypotheses When the Dependent Variable Consists of Frequencies of Scores in Various CategoriesClassifying DataTesting Hypotheses When the Dependent Variable Consists of Only Two PossibilitiesThe Binomial DistributionTesting Hypotheses About the Parameter p in a Binomial ExperimentThe Normal Distribution Approximation to the Binomial DistributionTesting Hypotheses About the Difference Between Two Binomial Parameters (p1 – p2)Testing Hypotheses in Which the Dependent Variable Consists of Two or More CategoriesSummaryConceptual ExercisesChapter 9: The Randomization/Permutation Model: An Alternative to the Classical Statistical Model for Testing Hypotheses About Treatment EffectsThe Assumptions Underlying the Classical Statistical ModelThe Assumptions Underlying the Randomization ModelHypotheses for Both ModelsThe Exact Randomization Test for Testing Hypotheses About the Effects of Different Treatments on BehaviorThe Approximate Randomization Test for Testing Hypotheses About the Effects of Different Treatments on BehaviorUsing the Randomization Model to Investigate Possible Effects of TreatmentsSingle-Participant Experimental DesignsSummaryConceptual ExercisesAdditional ResourcesChapter 10: Exploring the Relationship Between Two Variables: CorrelationMeasuring the Degree of Relationship Between Two Interval-Scale VariablesRandomization (Permutation) Model for Testing Hypotheses About the Relationship Between Two VariablesThe Bivariate Normal Distribution Model for Testing Hypotheses About Population CorrelationsCreating a Confidence Interval for the Population Correlation Using the Bivariate Normal Distribution ModelBootstrap Confidence Intervals for the Population CorrelationUnbiased Estimators of the Population CorrelationRobust Estimators of CorrelationAssessing the Relationship Between Two Nominal VariablesThe Fisher Exact Probability Test for 2 x 2 Contingency Tables With Small Sample SizesCorrelation Coefficients for Nominal Data in Contingency TablesSummaryConceptual ExercisesChapter 11: Exploring the Relationship Between Two Variables: The Linear Regression ModelAssumptions for the Linear Regression ModelEstimating Parameters With the Linear Regression ModelRegression and PredictionVariance and CorrelationTesting Hypotheses With the Linear Regression ModelSummaryConceptual ExercisesChapter 12: A Closer Look at Linear RegressionThe Importance of Looking at Our DataUsing Residuals to Check AssumptionsTesting Whether the Relationship Between Two Variables Is LinearThe Correlation Ratio: An Alternate Way to Measure the Degree of Relationship and Test for a Linear RelationshipWhere Do We Go From Here?When the Relationship Is Not LinearThe Effects of Outliers on RegressionRobust Alternatives to the Method of Least SquaresA Quick Peek at Multiple RegressionSummaryConceptual ExercisesChapter 13: Another Way to Scale the Size of Treatment EffectsThe Point Biserial Correlation Coefficient and the t-TestAdvantages and Disadvantages of Estimating Effect Sizes With Correlation Coefficients or Standardized Group Difference MeasuresConfidence Intervals for Effect Size EstimatesFinal Comments on the Use of Effect Size EstimatorsSummaryConceptual ExercisesChapter 14: Analysis of Variance for Testing for Differences Between Population MeansWhat Are the Sources of Variation in Our Experiments?Experimental and Statistical HypothesesEstimating VariancesWhen There Are More Than Two Conditions in Your ExperimentAssumptions for Analysis of VarianceTesting Hypotheses About Differences Among Population Means With Analysis of VarianceFactors That Affect the Power of the F-Test in Analysis of VarianceRelational Effect Size Measures for Analysis of VarianceRandomization Tests for Testing for Differential Effects of Three or More TreatmentsUsing ANOVA to Study the Effects of More Than One Factor on BehaviorPartitioning Variance for a Two-Factor Analysis of VarianceTesting Hypotheses With Two-Factor Analysis of VarianceTesting Hypotheses About Differences Among Population Means With Analysis of VarianceDealing With Unequal Sample Sizes in Factorial DesignsSummaryConceptual ExercisesChapter 15: Multiple Regression and BeyondOverview of the General Linear Model ApproachRegressionSimple Versus Multiple RegressionMultiple RegressionTypes of Multiple RegressionInteractions in Multiple RegressionContinuous x Continuous InteractionsCategorical x Continuous InteractionsCategorical x Categorical Interactions: ANOVA Versus RegressionSummaryConceptual ExercisesEpilogueAppendicesA. Some Useful Rules of AlgebraB. Rules of SummationC. LogarithmsD. The Inverse of the Cumulative Normal DistributionE. The Unit Normal DistributionF. The t-DistributionG. The Fisher r to zr TransformationH. Critical Values for F With Alpha = .05I. The Chi Square DistributionReferencesIndex
Mer från samma författare
Principles & Methods of Statistical Analysis
Stuart S. Miller, Donald A. Saucier, Jerome Frieman
1 093 kr
Du kanske också är intresserad av
Principles & Methods of Statistical Analysis
Stuart S. Miller, Donald A. Saucier, Jerome Frieman
1 093 kr
From Scrolls to Traditions
Stuart S. Miller, Michael D. Swartz, Steven Fine, Naomi Grunhaus, Alex P. Jassen
Inbunden, 2020
3 508 kr
- Signerad!
- Signerad!
SIGNERAD - Woka ur! Handbok i sydost- och östasiatisk matlagning
Vendela Wikström
Kartonnage, 2026
259 kr
- Signerad!
SIGNERAD - Mackans kost : Middagar och matlådor
Marcus Frank
Inbunden, 2026
269 kr
- Nyhet
- Nyhet