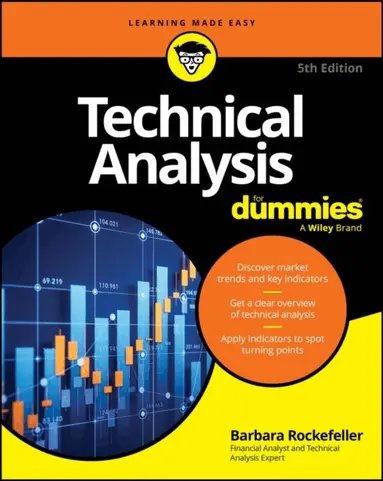

Technical Analysis For Dummies
260 kr
Beställningsvara. Skickas inom 7-10 vardagar. Fri frakt över 249 kr.
Fler format och utgåvor
Beskrivning
Understand and apply the latest evidence-based trading strategies and techniques in technical analysis In the newly revised fifth edition of Technical Analysis For Dummies, renowned economist and foreign exchange forecaster Barbara Rockefeller walks you through the basic principles, formulas, and techniques you need to reliably predict the movement of prices based on technical data. This straightforward guide shows you how to put technical knowledge to work to generate profitable trades and make lucrative decisions within your portfolio. This latest edition offers useful updates on new developments in the discipline, including the integration of artificial intelligence to analyze data, identify patterns, and make predictions. It also covers the incorporation of non-traditional data sources, like social media sentiment and web traffic. Technical Analysis For Dummies also provides: Step-by-step guidance on spotting market trends and key indicators of future price increases or decreasesBehavioral economics insights you can apply to your own trading strategy for immediate improvements in your risk-adjusted returnsDiscussions of the latest innovations in chartingWith comprehensive and cutting-edge explorations of the theories, trends, and science that animate technical analysis, Technical Analysis For Dummies explains the hands-on tools and techniques you’ll need to make informed, independent market decisions that maximize returns and minimize risk.

Produktinformation
- Utgivningsdatum:2026-06-02
- Mått:188 x 231 x 23 mm
- Vikt:499 g
- Format:Häftad
- Språk:Engelska
- Serie:For Dummies
- Antal sidor:368
- Upplaga:5
- Förlag:John Wiley & Sons Inc
- ISBN:9781394376933
Utforska kategorier
Mer om författaren
Barbara Rockefeller, BA, MA, is an international economist and forecaster specializing in foreign exchange. A pioneer in combining technical and fundamental analysis, she publishes daily reports for central banks, fund managers, and traders. She’s also the author of all previous editions of Technical Analysis For Dummies and five other books, including The FX Matrix.
Recensioner i media
Select Guide Rating
Innehållsförteckning
- Introduction 1About This Book 1Foolish Assumptions 3Icons Used in This Book 3Beyond the Book 4Where to Go from Here 4Part 1: Getting Started with Technical Analysis 5Chapter 1: Introducing Technical Analysis 7Stepping Up to Science 9Unpacking Lingo 10Buy-and-Hold Is Bunk 11Recognizing Who Uses Technical Analysis 13Remembering the Trend Is Your Friend 13Charting your path 14Picking a time frame 14Viewing the Scope of Technical Analysis 15Charting 16Market timing 16Trend-following 16Technical analysis 16Algorithmic trading 17Why Technical Analysis Works and What Can Go Wrong 20Setting new rules 21Controlling losses to protect gains 21Why Technical Analysis Gets a Bad Rap 22Beating the Market Is Hard Work 23Finding Order 24What You Need to Get Started 25Chapter 2: Tapping into the Wisdom of the Crowd 27Securities Are Not Socks 28The eBay Model of Supply and Demand 30Securities have their own economics 30Creating demand from scratch 31Identifying Crowd Behavior 32Defining Normal 33Reverting to the mean 33Trading mean reversion 34Breaking Normal 35Going against the grain: Retracements 36Recognizing why retracements happen 37Accepting When the Crowd Is Extreme 40Avoiding stampedes 41Lesser devilry — playing games with traders’ heads 42Chapter 3: Trade What You See: Market Sentiment 43The Origin of Market Sentiment 44Thinking Outside the Chart: Defending Sentiment 47Monitoring investors: The bull/bear ratio 47Following the money: Breadth indicators 47Viewing volatility: The VIX 48New and improved sentiment indicators 48Getting the Lowdown on Volume 49Tracking on-balance volume 50Refining volume indicators 50Leading the way with spikes 51Getting a two-for-the price-of-one coupon 52Blindsiding Yourself 52Understanding confirmation bias and anchoring 53Being aware of potential errors 54Thinking Scientifically 55Humility: Conditions and contingencies 55Sample size 56Chapter 4: Gaining Critical Advantage from Indicators 59Overcoming Noise 60Distinguishing between noise and an Event 61Knowing where noise comes from 61Noise from inside the market 62Indicators Give You the Edge 62Classifying indicators 63Understanding what indicators identify 64Choosing your trading style 64Examining How Indicators Work 66Finding relevant time frames 66Heeding indicator signals 67Establishing Benchmark Levels 69Choosing Indicators 70Examining Indicators in Detail 71Constructing a backtest 71The other top metrics 73Fixing the indicator 73Evaluating the risks of backtesting 74Chapter 5: Managing the Trade 75Finding Your Risk Profile 76What’s your ratio? 76Introducing positive expectancy 76Measuring the trade 77Considering your stake 77Adhering to the no-guru rule 78Building Trading Rules 78Creating your trading plan with four easy rules 79Combining indicators with trading rules 79Trading styles 80Knowing How Much Is Enough 81Using the First Line of Defense: Stop-Loss Orders 81Mental stops are hogwash 82Sorting out the types of stops 83Chapter 6: Taming Uncertainty: How to Use Technical Analysis 87Numbers Are Better than Words 87Distinguishing between feeling and thinking 88Realizing cognitive psychology is useful to technical trading 88Between a rock and a hard place 90Introducing Positive Expectancy 91Measuring the trade 92Considering your stake 92Adopting the Technical Mindset 94Chapter 7: Slicing the Pie 95Adjusting Positions 96Scaling in 96Scaling out 97What Is Asset Allocation? 97Tharp method 98Vince method 98Chapter 8: Using AI in Technical Analysis-Based Trading 101Exploring the Wonders of Perfect Memory 102Reviewing the Drawbacks of Using AI 103Not knowing what to ask 103Incomplete training 104Cost 105Picking an AI Program 105Getting Acquainted with AI Tools 106Part 2: Building Indicators From the Ground Up 109Chapter 9: Reading Basic Bars: How to Pounce on Opportunities 111Building Basic Bars 112Reality in a nutshell 112Setting the tone: The opening price 114Summarizing sentiment: The closing price 115Going up: The high 117Getting to the bottom of it: The low 119Putting It All Together: Using Bars to Identify Trends 119Identifying an uptrend 120Pinpointing a downtrend 121Overcoming Murky Bar Waters 121Paying heed to bar series 122Knowing when bar reading doesn’t work 122Framing Your Bars 123Using daily data 124Zooming out to a higher time frame 124Zooming in to a shorter time frame 125Applying Bar Reading in Real Time 128Chapter 10: Special Bars: An Early Warning System 129Finding Clues to Trader Sentiment 129Tick and bar placement 130Williams three-bar system 130Trading range 131Identifying Common Special Bars 132Closing on a high note 132Spending the day inside 133Getting outside for the day 133Finding the close at the open 133Decoding Spikes 133Getting Gaps 135Pinpointing a gap 135Using gaps to your advantage 137Filling the Gap 141Using the Trading Range as a Tool 142Paying attention to a changing range 142Determining the meaning of a range change 143Looking at the average trading range 144Chapter 11: Redrawing the Price Bar: Japanese Candlesticks 149Appreciating the Candlestick Advantage 150Dissecting the Anatomy of a Candlestick 150Drawing the real body 151Doing without a real body: The doji 152Catching the shadow 152Sizing Up Emotions 155Identifying Special Emotional Extreme Candlestick Patterns 157Interpreting candlestick patterns 157Turning to reversal patterns 159Bearish engulfing candlestick 159Shooting star 159Continuation patterns 159Combining Candlesticks with Other Indicators 161Trading on Candlesticks Alone 163Part 3: Finding Patterns 165Chapter 12: Seeing Patterns 167Introducing Patterns 168Using imagination 168Coloring inside the lines 170Cozying Up to Continuation Patterns 170Ascending and descending triangles 170Dead-cat bounce 171Cup and handle 172Recognizing Classic Reversal Patterns 173Double bottom 173Double tops 175The ultimate triple top: Head-and-shoulders 176Evaluating the Measured Move 177Taking dictation from the pattern 177Resuming the trend after retracement 179Measuring from the gap 179Current-day warning 179Chapter 13: Drawing Trendlines 181Looking Closely at a Price Chart 182Following the Rules with Rule-Based Trendlines 182Drawing support and resistance lines 182Using the support line to enter and exit 183Noting breakouts and false breakouts 184Using resistance to enter and exit 185Being aware of the 1-2-3 Rule 187Playing games with support and resistance lines 188Do Prices Pivot? 189Drawing Internal Trendlines 191Rules for drawing a linear regression 191Identifying trendedness 192Using the linear regression 194Chapter 14: Transforming Channels into Forecasts 197Diving into Channel-Drawing Basics 197The swing bar problem 198Drawing channels by hand 198Benefitting from channels 200Delving into the drawbacks of channels 201Channeling to make gains and avoid losses 201Riding the Regression Range 201Introducing the standard deviation 202Drawing a linear regression channel 202Confirming hand-drawn channels 204Sizing up the special features of the linear regression channel 204Discovering the drawbacks of linear regression channels 205Dealing with Breakouts 206Distinguishing between false breakouts and the real thing 207Putting breakouts into context 210Part 4: Dynamic Analysis 213Chapter 15: Using Dynamic Lines 215Introducing the Simple Moving Average 216Starting with the crossover rule 217Using the moving average level rule 219Dealing with limitations 220Comparing moving average rules with Donchian rules 223Magic moving average numbers 223Adjusting the Moving Average 224Weighted and exponential moving averages 225Adaptive moving averages 225Wild and woolly moving averages 226Choosing a moving average type 226Using Multiple Moving Averages 227Putting two moving averages into play 228Trying the three-way approach 229Throw them all at the wall and see what sticks 230Delving into Moving Average Convergence and Divergence 231Calculating convergence and divergence 232Creating a decision tool 233Interpreting the MACD 234Chapter 16: Measuring Momentum 237Doing the Math: Calculating Momentum 238Simple momentum 239Using the rate-of-change method 240Pondering the Trickier Aspects of Momentum 242Smoothing price changes 242Filtering momentum 243Applying Momentum 244Discovering divergence 244Confirming trend indicators 245Determining the Relative Strength Index (RSI) 245Calculating the RSI 246Picturing RSI 247Filtering RSI 249Using the Rest of the Price Bar: The Stochastic Oscillator 250Step 1: Putting a number to the fast stochastic %K 250Step 2: Refining %K with %D 252Fiddling with the stochastic oscillator on the chart 252Chapter 17: Estimating Volatility 255Catching a Slippery Concept 256How volatility arises 257Low volatility with trending 257Low volatility without trending 258High volatility with trending 258High volatility without trending 258Measuring Volatility 259Tracking the maximum move 259Considering the standard deviation 260Using the average true range indicator 260Applying Volatility Measures: Bollinger Bands 262Applying Stops with Average True Range Bands 263Chapter 18: Ignoring Time to Create Better Timing 267Focusing on Tick Bars: In the Spirit of Ignoring Time 268Narrowing the Focus to the Move Itself: The Constant Range Bar 269Defining a constant range bar 269Identifying what criteria are needed 270Catching the Big Kahuna: Point-and-Figure Charts 270Visualizing What’s Important 271Putting each move into a column 271Dealing with box size 273Applying Patterns 274Support and resistance 274Double and triple tops and bottoms 275Projecting Prices after a Breakout 276Using vertical price projection 276Applying horizontal projection 277Combining P&F Techniques with Other Indicators 278Chapter 19: Combining Techniques 279Adding a New Indicator: Introducing Complexity 280Choosing primary and secondary indicators 281Inserting unexpected validators 281Studying a classic combination 282Sailing into Outer Space 286The Conquistador 286Wave with relative strength 287Enhancing gains with selective timing 288Trading with Limited Expectancy: Semi-System, Setup, and Guerilla Trading 288Semi-system “discretionary” trading 289Solving the squaring problem — setups 290Guerrilla trading 293Chapter 20: Judging Cycles and Waves 295Defining a Cycle and a Wave 295Starting with economics 297Combining market metrics with cycles 298Moving on to magic numbers 299Using cycles 299Cycling with Supply and Demand: The Pragmatic Mr Wyckoff 300Finding Universal Harmony: Hurst’s Magic Numbers 301Looking to the Moon and the Stars 302Examining the lunar cycle 302Adding more celestial bodies 303Including the sun 303Figuring out what’s (maybe) wrong with astronomy cycle theories 303Following the Earth’s Axis: Seasonality and Calendar Effects 304Differentiating between seasonality and calendar effects 304The most well-known calendar effects 304Examining Big-Picture Cycle Theories 305Shining a Spotlight on the Magnificent Mr Gann 306Applying core Gann concepts 306Celebrating Gann’s 50 percent retracement rule 307Embracing the Most Popular Wave Idea: The Elliott Wave 308Looking closer at the Elliott Wave 309Validating retracements 310Chapter 21: The Mind-Blowing Ichimoku 313Taking a Closer Look at Ichimoku 313Defining ichimoku and its characteristics 314Eyeing ichimoku’s differences with conventional technical analysis 314Adapting to new core concepts 315Building a cloud: Starting with moving averages 316Grasping Why Analysts Rely on Ichimoku and Why You Can 319Using Ichimoku in Your Analysis 321Venturing inside the cloud 321Changing time frames 321Trading with Ichimoku 322Part 5: the Part of Tens 325Chapter 22: Ten Secrets of the Top Technical Traders 327Appreciate Probability 328Recordkeeping Matters 328The Trend Is Your Friend 328Entries Count as Much as Exits 329Stops Aren’t Optional 329Treat Trading as a Business 330Eat Your Spinach 330Technical Stuff Never Goes Out of Date 331Diversify 331Swallow Hard and Accept Some Math 332Chapter 23: Ten Rules for Working with Indicators 333Don’t Jump the Gun 333Defeat Your Math Gremlins 334Embrace Patterns 334Use Support and Resistance 335Follow the Breakout Principle 335Watch for Convergence and Divergence 335Backtest or Practice-Trade Honestly 336Accept That Your Indicators Will Fail 337Get Over the Idea of Secret Indicators 337Open Your Mind 338Appendix: Additional Resources 339Index 345
Hoppa över listan


Mer från samma serie
Python All-in-One For Dummies
John C. Shovic, Alan Simpson
Häftad, 2024
4,0 utav 5 stjärnor. Totalt antal röster:(1)
361 kr
- Nyhet