
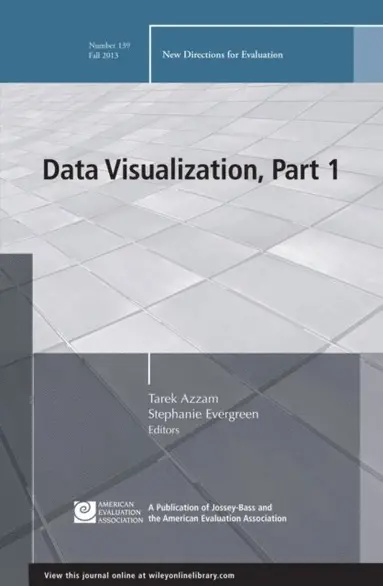
Data Visualization, Part 1
New Directions for Evaluation, Number 139
AvStephanie Evergreen,Tarek Azzam
E-bok
PDF, Engelska, 2013341 kr
Läs direkt i Bokus Reader – eller ladda ned till din enhet (PDF kräver ofta zoom och scroll på små skärmar).
Fler format och utgåvor
Beskrivning
Do you communicate data and information to stakeholders? This issue is Part 1 of a two-part series on data visualization and evaluation. In Part 1, we introduce recent developments in the quantitative and qualitative data visualization field and provide a historical perspective on data visualization, its potential role in evaluation practice, and future directions. It discusses:
- Quantitative visualization methods such as tree maps
- Sparklines
- Web-based interactive visualization
- Different types of qualitative data visualizations, along
with examples in various evaluation contexts - A toolography describing additional data visualization tools
and software, along with their major strengths and limitations.
Intended as a guidance for understanding and designing data visualizations, this issue introduces fundamental concepts and links them to daily practice.
This is the 139th volume of the Jossey-Bass quarterly report series New Directions for Evaluation, an official publication of the American Evaluation Association.
Produktinformation
Utforska kategorier
Hoppa över listan







Du kanske också är intresserad av
Del 13
Emerging Practices in International Development Evaluation
Stewart I. Donaldson, Tarek Azzam, Ross F. Conner
Inbunden, 2013
1 133 kr
Emerging Practices in International Development Evaluation
Ross F. Conner, Tarek Azzam, Stewart I. Donaldson
E-bok
2013664 kr
Emerging Practices in International Development Evaluation
Stewart I. Donaldson, Tarek Azzam, Ross F. Conner
Häftad, 2013
622 kr
Emerging Practices in International Development Evaluation
Ross F. Conner, Tarek Azzam, Stewart I. Donaldson
E-bok
2013443 kr
- Nyhet